
 Say hello!
 16990 Dallas Pkwy, Suite 206
 info@lynkedup.tech
 +1 866-259-6533
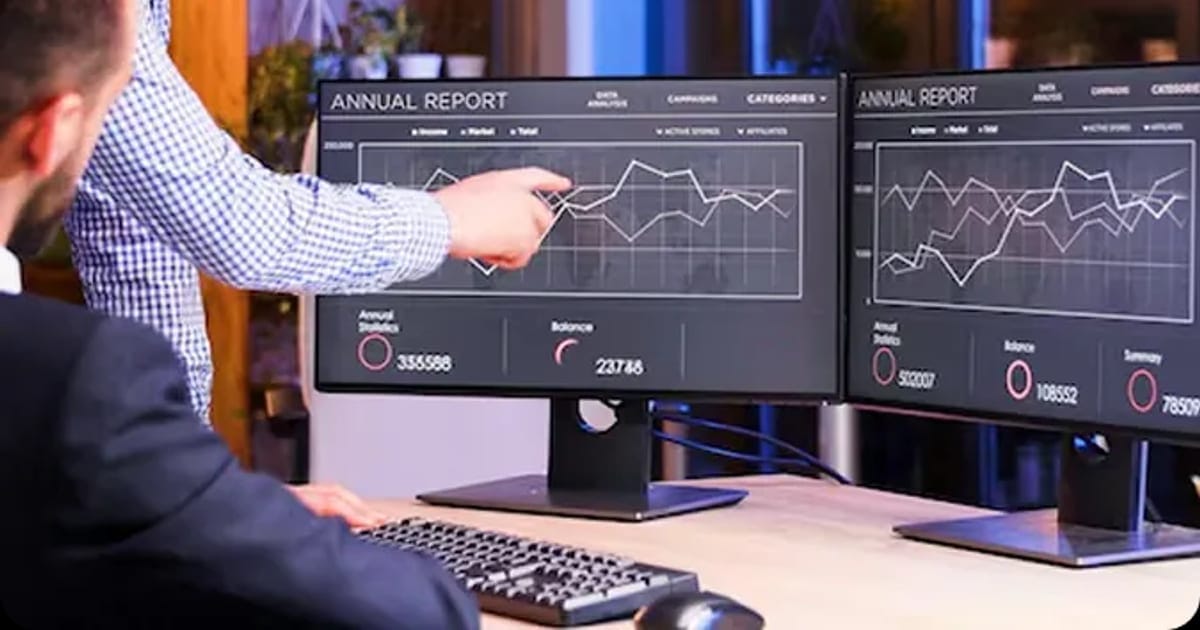
Business intelligence dashboards should answer operational questions quickly. A polished chart is not useful if data definitions are inconsistent or managers cannot act on what they see.
Benefits of BI dashboards
- Faster decisions: leaders see trends without waiting for a weekly report.
- One version of the truth: shared definitions end arguments over numbers.
- Early warnings: alerts surface stalled jobs or slipping margins sooner.
- Less manual reporting: data refreshes automatically from source systems.
- Accountability: each metric has an owner and a next action.
Dashboard examples
- Sales: lead volume by source, response time, conversion rate and pipeline value.
- Operations: jobs by status, delays by stage, crew utilization and turnaround time.
- Finance: revenue, project margin, outstanding invoices and cash collected.
- Customer service: open requests, time to resolution and repeat issues.
- Executive: a few headline numbers with drill-down to the detail.
Begin with decisions, not charts
Choose the questions leaders ask every week: Where are jobs delayed? Which leads go cold? How does project margin vary? Then identify the data needed to answer them.
Build for the audience
Executives need trends and exceptions; managers need drill-down; field teams need next actions. Design access and refresh cadence around real responsibilities.
Make data quality visible
Show data freshness, sources and known gaps. Alerts and follow-up ownership turn dashboards into a management process instead of a passive report.
Off-the-shelf BI or custom dashboards?
Business intelligence solutions range from packaged BI tools to custom reporting dashboards built into your own systems. Packaged tools are fast to start; BI dashboard development makes sense when the data lives in custom systems or the questions are specific to your operation. Custom operations dashboard development often pairs with data analytics services to clean and model the data first.
How Lynked Up can help
We build reporting around the business as part of our data and business intelligence work, often alongside ERP and integration projects.
Frequently asked question
What should the first dashboard show?
Start with a few measurable decisions that currently require multiple spreadsheets or manual meetings.